Задание
Заполните таблицу значений функции \(\displaystyle y=\frac{1}{x}{\small :}\)
| \(\displaystyle \small x\) | \(\displaystyle \small -2\) | \(\displaystyle \small -1{,}25\) | \(\displaystyle \small -1\) | \(\displaystyle \small -0{,}8\) | \(\displaystyle \small -0{,}5\) | \(\displaystyle \small -0{,}4\) |
| \(\displaystyle \small y=\frac{1}{x}\) |
| \(\displaystyle \small x\) | \(\displaystyle \small 0{,}4\) | \(\displaystyle \small 0{,}5\) | \(\displaystyle \small 0{,}8\) | \(\displaystyle \small 1\) | \(\displaystyle \small 1{,}25\) | \(\displaystyle \small 2\) |
| \(\displaystyle \small y=\frac{1}{x}\) |
Постройте гиперболу по полученным точкам:
Решение
Заполним таблицу значений функции \(\displaystyle y=\frac{1}{x}{\small :}\)
| \(\displaystyle \small x\) | \(\displaystyle \small -2\) | \(\displaystyle \small -1{,}25\) | \(\displaystyle \small -1\) | \(\displaystyle \small -0{,}8\) | \(\displaystyle \small -0{,}5\) | \(\displaystyle \small -0{,}4\) |
| \(\displaystyle \small y=\frac{1}{x}\) | \(\displaystyle \small \frac{1}{-2}\) | \(\displaystyle \small \frac{1}{-1{,}25}\) | \(\displaystyle \small \frac{1}{-1}\) | \(\displaystyle \small \frac{1}{-0{,}8}\) | \(\displaystyle \small \frac{1}{-0{,}5}\) | \(\displaystyle \small \frac{1}{-0{,}4}\) |
| \(\displaystyle \small x\) | \(\displaystyle \small 0{,}4\) | \(\displaystyle \small 0{,}5\) | \(\displaystyle \small 0{,}8\) | \(\displaystyle \small 1\) | \(\displaystyle \small 1{,}25\) | \(\displaystyle \small 2\) |
| \(\displaystyle \small y=\frac{1}{x}\) | \(\displaystyle \small \frac{1}{0{,}4}\) | \(\displaystyle \small \frac{1}{0{,}5}\) | \(\displaystyle \small \frac{1}{0{,}8}\) | \(\displaystyle \small \frac{1}{1}\) | \(\displaystyle \small \frac{1}{1{,}25}\) | \(\displaystyle \small \frac{1}{2}\) |
Вычисляем значения:
| \(\displaystyle \small x\) | \(\displaystyle \small -2\) | \(\displaystyle \small -1{,}25\) | \(\displaystyle \small -1\) | \(\displaystyle \small -0{,}8\) | \(\displaystyle \small -0{,}5\) | \(\displaystyle \small -0{,}4\) |
| \(\displaystyle \small y=\frac{1}{x}\) | \(\displaystyle \small -0{,}5\) | \(\displaystyle \small -0{,}8\) | \(\displaystyle \small -1\) | \(\displaystyle \small -1{,}25\) | \(\displaystyle \small -2\) | \(\displaystyle \small -2{,}5\) |
| \(\displaystyle \small x\) | \(\displaystyle \small 0{,}4\) | \(\displaystyle \small 0{,}5\) | \(\displaystyle \small 0{,}8\) | \(\displaystyle \small 1\) | \(\displaystyle \small 1{,}25\) | \(\displaystyle \small 2\) |
| \(\displaystyle \small y=\frac{1}{x}\) | \(\displaystyle \small 2{,}5\) | \(\displaystyle \small 2\) | \(\displaystyle \small 1{,}25\) | \(\displaystyle \small 1\) | \(\displaystyle \small 0{,}8\) | \(\displaystyle \small 0{,}5\) |
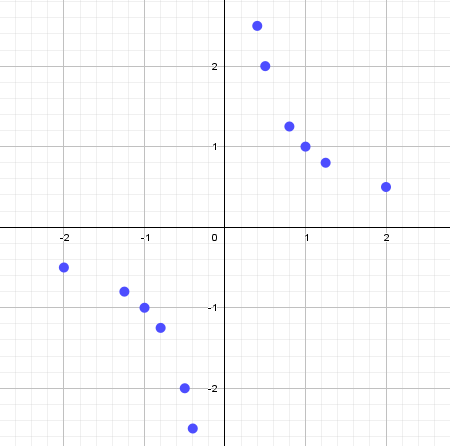
Построим точки на плоскости:
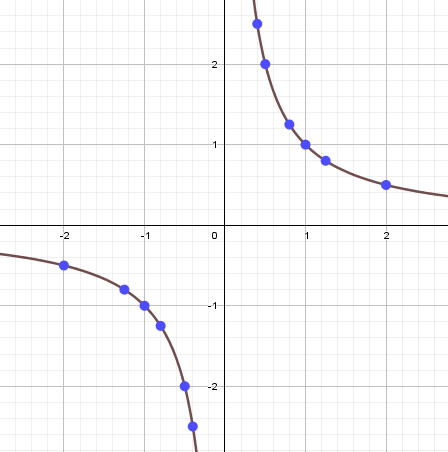
Построим график функции \(\displaystyle y=\frac{1}{x}\) (гиперболу) по полученным точкам, добавляя еще точки, если это необходимо:
Замечание / комментарий
Построение по точкам
Если построить по оси \(\displaystyle ОХ\) много точек с координатами от \(\displaystyle -2 \) до \(\displaystyle 2{\small , } \) то получаем следующую картинку графика: