Задание
Заполните таблицу значений функции \(\displaystyle y=|x|{\small :}\)
| \(\displaystyle x\) | \(\displaystyle \small -5\) | \(\displaystyle \small -4\) | \(\displaystyle \small -3\) | \(\displaystyle \small -2\) | \(\displaystyle \small -1\) |
| \(\displaystyle y=|x|\) |
| \(\displaystyle x\) | \(\displaystyle \small 0\) | \(\displaystyle \small 1\) | \(\displaystyle \small 2\) | \(\displaystyle \small 3\) | \(\displaystyle \small 4\) | \(\displaystyle \small 5\) |
| \(\displaystyle y=|x|\) |
Мысленно постройте график функции по полученным точкам.
Решение
Заполним таблицу значений функции \(\displaystyle y=|x|{\small :}\)
| \(\displaystyle x\) | \(\displaystyle \small -5\) | \(\displaystyle \small -4\) | \(\displaystyle \small -3\) | \(\displaystyle \small -2\) | \(\displaystyle \small -1\) |
| \(\displaystyle y=|x|\) | \(\displaystyle \small |-5|\) | \(\displaystyle \small |-4|\) | \(\displaystyle \small |-3|\) | \(\displaystyle \small |-2|\) | \(\displaystyle \small |-1|\) |
| \(\displaystyle x\) | \(\displaystyle \small 0\) | \(\displaystyle \small 1\) | \(\displaystyle \small 2\) | \(\displaystyle \small 3\) | \(\displaystyle \small 4\) | \(\displaystyle \small 5\) |
| \(\displaystyle y=|x|\) | \(\displaystyle \small |0|\) | \(\displaystyle \small |1|\) | \(\displaystyle \small |2|\) | \(\displaystyle \small |3|\) | \(\displaystyle \small |4|\) | \(\displaystyle \small |5|\) |
Вычисляем значения:
| \(\displaystyle x\) | \(\displaystyle \small -5\) | \(\displaystyle \small -4\) | \(\displaystyle \small -3\) | \(\displaystyle \small -2\) | \(\displaystyle \small -1\) |
| \(\displaystyle y=|x|\) | \(\displaystyle \small 5\) | \(\displaystyle \small 4\) | \(\displaystyle \small 3\) | \(\displaystyle \small 2\) | \(\displaystyle \small 1\) |
| \(\displaystyle x\) | \(\displaystyle \small 0\) | \(\displaystyle \small 1\) | \(\displaystyle \small 2\) | \(\displaystyle \small 3\) | \(\displaystyle \small 4\) | \(\displaystyle \small 5\) |
| \(\displaystyle y=|x|\) | \(\displaystyle \small 0\) | \(\displaystyle \small 1\) | \(\displaystyle \small 2\) | \(\displaystyle \small 3\) | \(\displaystyle \small 4\) | \(\displaystyle \small 5\) |
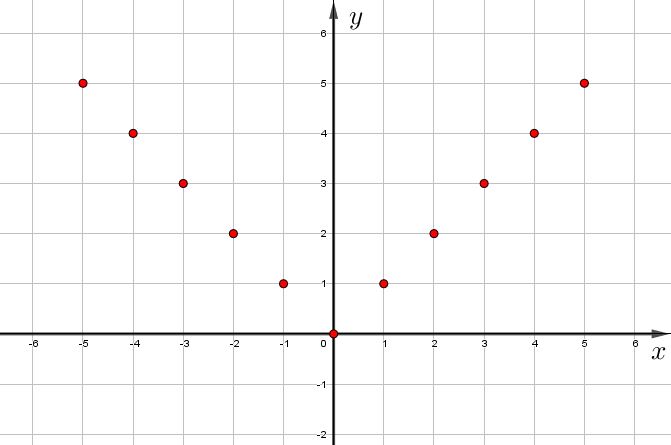
Построим точки на плоскости:
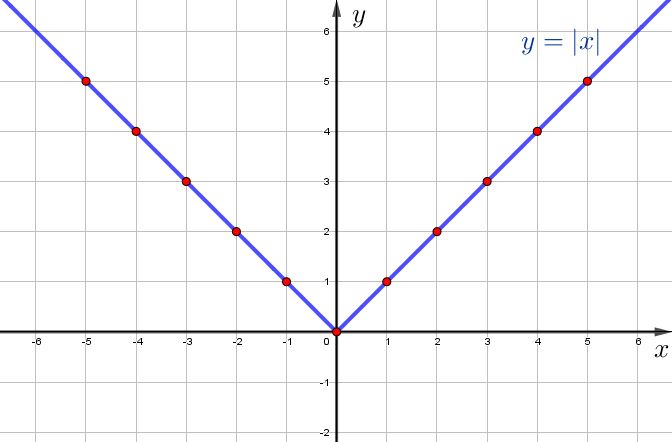
Построим график функции \(\displaystyle y=|x|\) по полученным точкам, добавляя еще точки, если это необходимо:
Замечание / комментарий
Построение по точкам
Если построить по оси \(\displaystyle ОХ\) много точек с координатами (например, от \(\displaystyle -6 \) до \(\displaystyle 6 \)), то получаем следующую картинку графика: